
Centralize Your Google Ads, Meta, and Microsoft Campaigns in Data Studio (Complete Guide)

The goal: a centralized dashboard, always up to date and accessible anywhere
Managing several clients across Google Ads, Meta, and Microsoft, I was spending a lot of time juggling between interfaces and compiling exports by hand. I needed a single place to bring together the results of all campaigns, across every channel.
The goal was twofold: save time on reporting and, more importantly, spot performance drops or spikes faster — rather than waiting for a monthly export to realize a campaign had fallen off.
So I decided to build a dashboard that updates automatically and stays accessible at all times, whether for a client check-in or day-to-day monitoring.
Why Windsor.ai, BigQuery, and Data Studio
For this type of project, several approaches were possible, with three choices to make: how to import the data, where to store it, and which tool to display it with. I settled on Windsor.ai for the import, BigQuery for storage, and Data Studio for the dashboard.
Windsor.ai as the connector: unlike Data Studio’s native connectors, Windsor centralizes multiple platforms (in my case: Google Ads, Meta, Microsoft, GA4, LinkedIn) into a consistent format, without having to manage a separate integration for each source. That’s a significant time saver once you go beyond 2-3 platforms.
BigQuery as the intermediate layer: connecting Windsor directly to Data Studio is possible, but it severely limits what you can do with the data — no transformation, no proper historization, no business logic (segmentation, calculated KPIs). By routing through BigQuery, raw data is stored, transformed via SQL views, and the dashboard simply displays an already-clean result. It’s also what makes it possible to manage multiple clients with the same architecture, just by duplicating the views.
Data Studio to display the data: free, native to the Google ecosystem, and sufficient for most client reporting needs — in my case, I don’t need a heavier BI tool like Power BI.
Étape 1 : connecter les sources avec Windsor.ai
Creating the dataset and tables in BigQuery
Before importing data from Windsor, the destination needs to exist on the Google Cloud side. This involves three steps:
- Create a BigQuery project (or use an existing one) in the Google Cloud console, with the BigQuery API enabled.
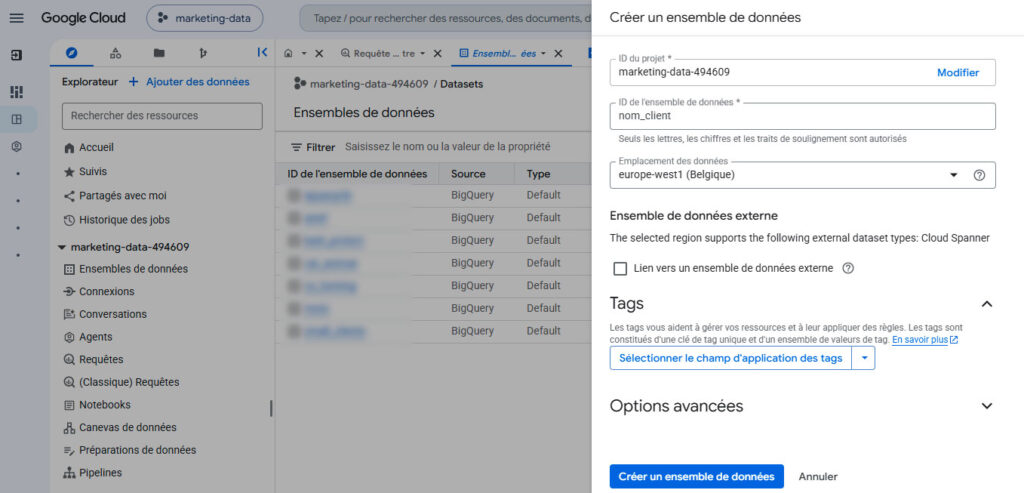
- Create a dedicated dataset — I named mine
ads_data— to hold all the tables related to the Windsor import. If you manage several clients, I’d recommend creating one dataset per client to keep a clean structure. - Let Windsor create the tables automatically on the first import: once the dataset is set in Windsor’s configuration, the tool generates the raw table itself and populates it on every sync, with no need to define the schema manually.
This raw table, once populated, is what serves as the starting point for structuring the data into views (ads_segmented, ads_kpis…), covered in detail in the next step.
Setting up the Windsor connectors
Once your Windsor.ai account is created, connecting the sources happens platform by platform: you authorize access to the various ad and analytics accounts through standard OAuth authentication. Windsor then lets you choose which fields to import (impressions, clicks, cost, conversions…) and how often to sync.
For my reports, I import by default: date, source, spend, impressions, clicks, conversions, campaign ID, and campaign labels. With these KPIs, I have what I need for weekly tracking. Calculated metrics (CPC, CPA, and conversion rate) are computed directly in Data Studio.
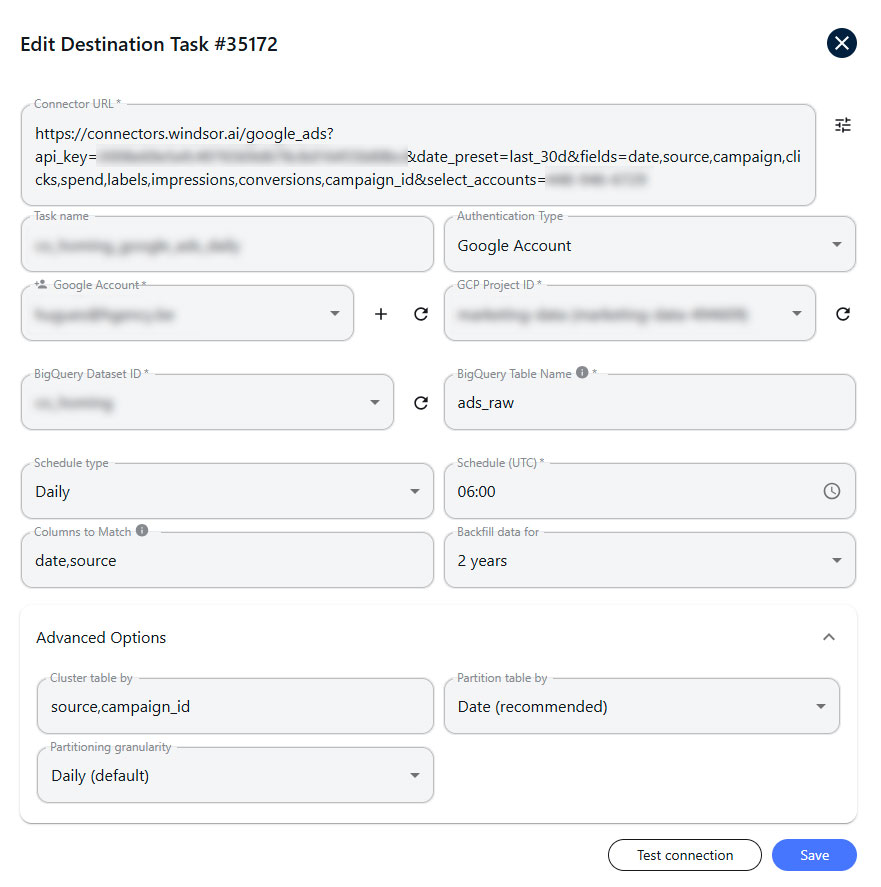
Once the connectors are configured, the data flows automatically into a single table, ready to be used in BigQuery.
Step 2: Structuring the data in BigQuery
Data imported from Windsor is first stored in ads_raw. I then pass it through three successive views to enrich the data:
- ads_segmented enriches each raw row with business segmentation — language, campaign type, site — extracted from campaign labels, without changing the level of detail.
- ads_kpis aggregates this enriched data by day, source, and segment, moving from row-by-row detail to consolidated totals.
- ads_suivi_unpivot recalculates the totals over rolling periods (7 days, 14 days, 28 days, last month, last 6 months — the reference periods for my reports) and restructures them into rows so Data Studio can display them easily.
Each view builds on the previous one: the chain is linear, which makes it possible to debug it step by step rather than having to manage everything in a single, complex query.
The raw table (ads_raw)
This is the table that Windsor populates automatically on every sync — one row per day, per campaign, per platform, with the raw fields defined in the connector’s configuration.
Segmentation by channel/campaign (ads_segmented)
In this view, I enrich each row with segmentation extracted from campaign labels. I use the labels to categorize my campaigns by language, campaign type, keywords, and so on.
CREATE VIEW `mon_projet.mon_client.ads_segmented` AS
SELECT
  date,
  source,
  campaign_id,
  campaign,
  COALESCE(cost, CAST(spend AS FLOAT64)) AS cost,
  CAST(impressions AS FLOAT64) AS impressions,
  CAST(clicks AS FLOAT64) AS clicks,
  CAST(conversions AS FLOAT64) AS conversions,
  REGEXP_EXTRACT(campaign_labels, r'lang:([a-z]+)') AS langue,
  REGEXP_EXTRACT(campaign_labels, r'type:([a-z]+)') AS type_campagne,
  REGEXP_EXTRACT(campaign_labels, r'site:([a-z0-9]+)') AS site
FROM `mon_projet.mon_client.ads_raw`
Two points worth watching here, based on experience:
- Cost: depending on the platform, Windsor may route spend to spend rather than cost — COALESCE prevents data from being lost.
- Typing: imported fields sometimes come through as BIGNUMERIC, a type Data Studio doesn’t recognize as a metric. A CAST(… AS FLOAT64) at this stage fixes the problem for good.
Consolidated KPIs view (ads_kpis)
This view aggregates ads_segmented by day, source, and segment:
CREATE VIEW `mon_projet.mon_client.ads_kpis` AS
SELECT
  date,
  source,
  langue,
  type_campagne,
  site,
  SUM(impressions) AS impressions,
  SUM(clicks) AS clicks,
  SUM(cost) AS cost,
  SUM(conversions) AS conversions
FROM `mon_projet.mon_client.ads_segmented`
GROUP BY date, source, langue, type_campagne, site
Metrics like CPC or CPA are deliberately not calculated here: computing them directly in Data Studio (via SUM(cost)/SUM(clicks)) prevents them from being skewed by aggregation — a ratio pre-calculated upstream ends up being summed rather than recalculated once it’s displayed across multiple rows.
Unpivoting for time-based reporting (ads_suivi_unpivot)
Final step: recalculate the totals over rolling periods, then transform them from columns into rows so Data Studio can work with them easily.
CREATE VIEW `mon_projet.mon_client.ads_suivi_unpivot` AS
WITH base AS (
  SELECT
    source, langue, type_campagne, site,
    SUM(IF(date >= DATE_SUB(CURRENT_DATE(), INTERVAL 7 DAY), cost, 0)) AS cost_7d,
    SUM(IF(date >= DATE_SUB(CURRENT_DATE(), INTERVAL 7 DAY), conversions, 0)) AS conversions_7d,
    SUM(IF(date >= DATE_TRUNC(DATE_SUB(CURRENT_DATE(), INTERVAL 1 MONTH), MONTH)
           AND date < DATE_TRUNC(CURRENT_DATE(), MONTH), cost, 0)) AS cost_m1, SUM(IF(date >= DATE_TRUNC(DATE_SUB(CURRENT_DATE(), INTERVAL 1 MONTH), MONTH)
           AND date < DATE_TRUNC(CURRENT_DATE(), MONTH), conversions, 0)) AS conversions_m1
    -- ... même logique pour 14j, 28j, 6 mois
  FROM `mon_projet.mon_client.ads_kpis`
  GROUP BY source, langue, type_campagne, site
)
SELECT source, langue, type_campagne, site, periode, cost, conversions
FROM base
UNPIVOT (
  (cost, conversions) FOR periode IN (
    (cost_7d, conversions_7d) AS '7 derniers jours',
    (cost_m1, conversions_m1) AS 'Mois dernier'
    -- ... autres périodes
  )
)
Important point: the “last month” period deliberately excludes the current month via DATE_TRUNC — otherwise, an incomplete month would skew the comparison with previous months.
Step 3: Creating the Data Studio dashboard
To bring the data into Data Studio, simply add a new data source via the native BigQuery connector, then select the project, dataset, and view to connect — typically ads_suivi_unpivot, which already contains the comparison periods ready to use.
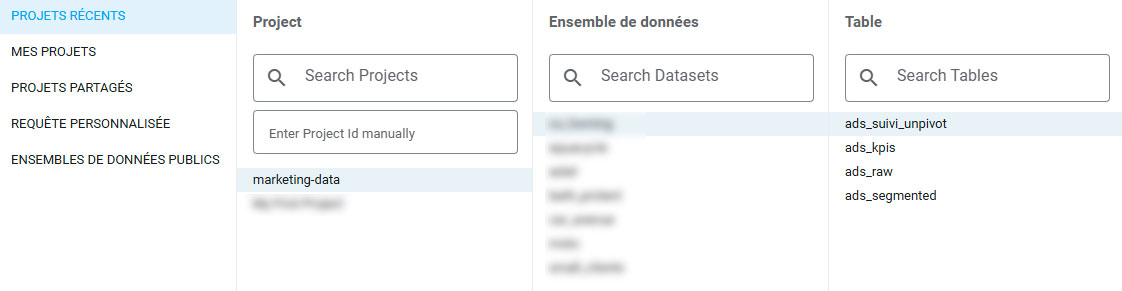
Periods already prepared, thanks to ads_suivi_unpivot
All the period calculation logic — last 7 days, last 14 days, last 28 days, last month, last 6 months — has already been prepared in step 2, in the ads_suivi_unpivot view. That means there’s nothing left to calculate on the Data Studio side: you just need to filter or group by the periode field to display the desired comparison, without setting up a custom date range for every chart.
This is what makes it possible, for example, to build a table comparing the last 7 days to last month side by side, simply by selecting the two corresponding periode values — without writing any date logic in Data Studio itself.
Calculating metrics with SUM() instead of pre-calculating them
Metrics like CPC, CPA, or conversion rate are calculated directly in Data Studio using calculated fields, for example:
CPC = SUM(cost) / SUM(clicks)
This choice isn’t trivial: a metric pre-calculated in BigQuery (like an already-divided CPA) ends up being summed rather than recalculated once it’s displayed across multiple aggregated rows — and the resulting total no longer makes sense. Using SUM() on the raw values (cost, clicks, conversions) inside the calculated field guarantees the ratio stays correct, no matter what level of aggregation is displayed.
Building tables and charts
From here, you have everything you need to build your tracking tables and charts to check the performance of each campaign or campaign segment in real time. Here are a few examples of tables I check daily:
- CPA trend over time — a line chart across the different rolling periods (7d, 14d, 28d), to quickly spot a drift
- Budget split by platform — a pie chart or stacked bar chart on source, to see at a glance where the spend is going
- Cross-tab by segment — langue or type_campagne as the dimension, with CPC/CPA/conversion rate as calculated metrics, to compare segments against each other
Results: what this changes day to day
Time saved on client reporting
What used to require multiple manual exports per platform and per client now comes down to a dashboard that’s always up to date, with no manual work involved. The time freed up gets reinvested in analyzing campaigns rather than compiling them.
Faster detection of tracking anomalies
With data centralized and compared across several rolling periods, an anomaly — a campaign that drops off, an unusual cost spike, a conversion that disappears — stands out at a glance, rather than being discovered in a monthly export.
A custom report, accessible directly by the client
This architecture also makes it possible to build, from the same views, a dedicated Data Studio report shared directly with the client — with their own filters, their own segments, without giving them access to the ad accounts or to BigQuery. The client keeps an autonomous, up-to-date view of their performance, without depending on a manually sent report.
How much does a centralized marketing dashboard cost
On this stack, the only real cost is Windsor.ai — BigQuery and Data Studio stay free given the data volumes involved here (a few million rows per month, well within BigQuery’s free quotas).
For Windsor, the price mainly depends on the number of ad accounts to connect. In my case, managing around fifteen clients with several accounts each, I’m on a higher-tier plan, billed annually. But for a single company centralizing its own campaigns (Google Ads, Meta, Microsoft…), the base plan at €25 is more than enough. It covers 75 accounts across 3 different sources, which leaves plenty of room even with several platforms and several accounts per platform.
That’s the full stack — adapt it to your own platforms and needs. Happy reporting!